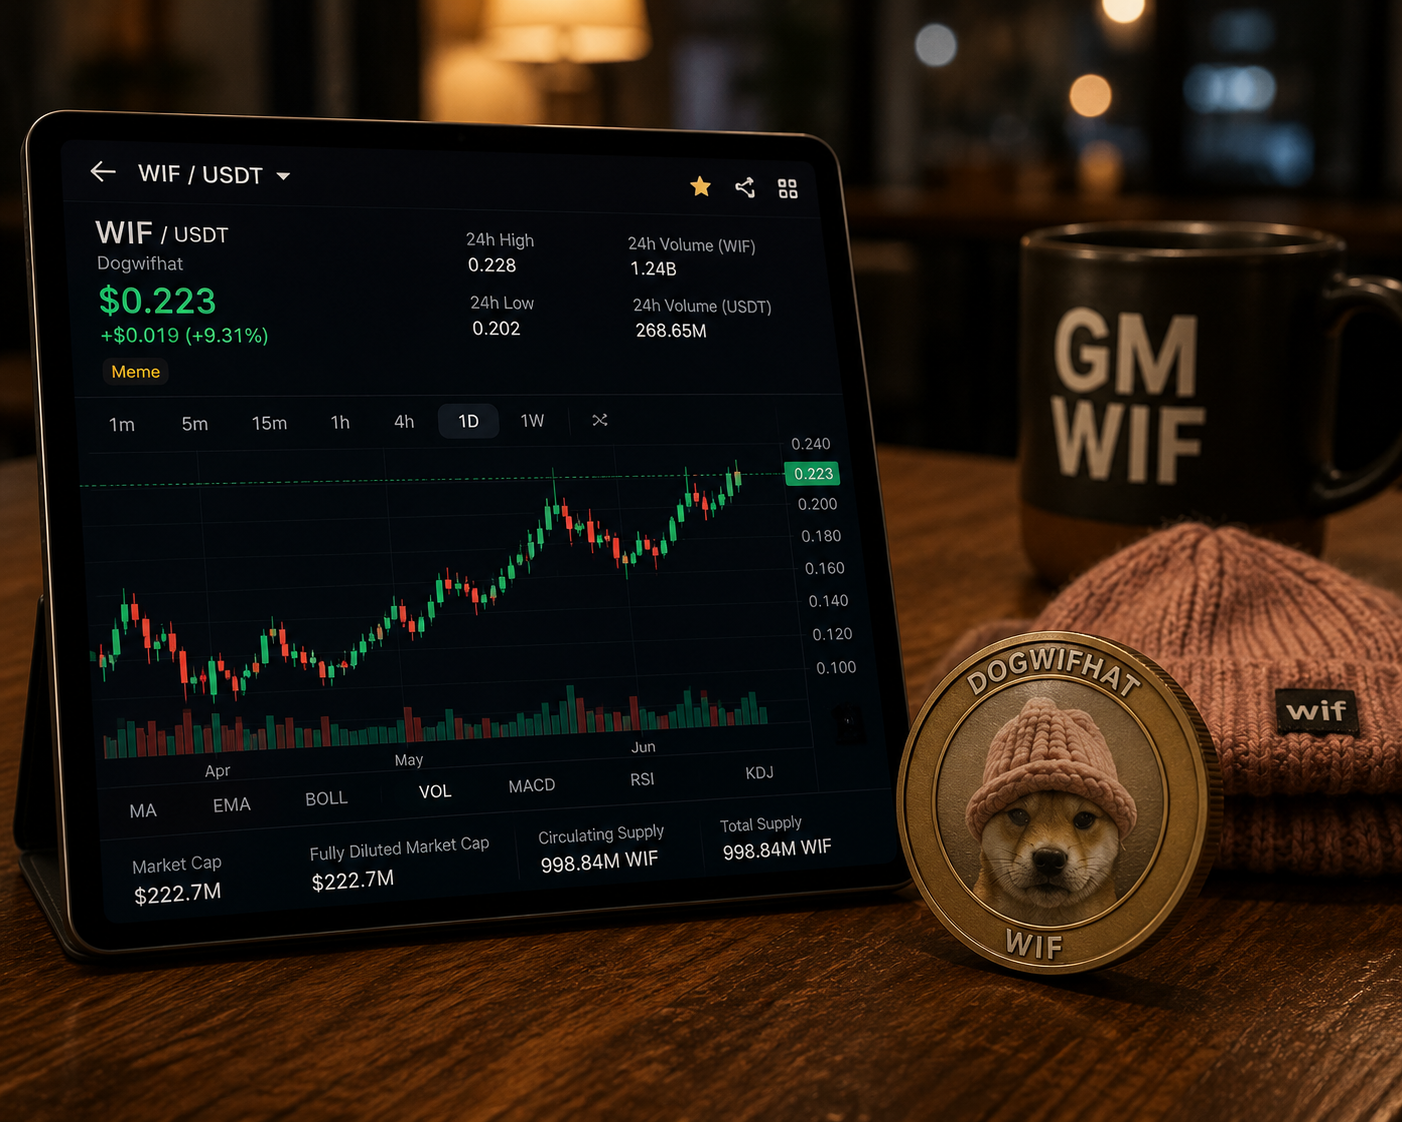
The cryptocurrency market has been bullish since the start of the week, but WIF, the native token of Dogwifhat, has been one of the best performers over the past few days.
WIF extends its recovery on Wednesday and temporarily hit the $0.2600 level before retracing to now trade at $0.223 at press time.
The rally is supported by improving market sentiment, with the bulls looking to push its price higher in the near term.
Cooling retail demand could halt WIF’s rally
WIF is up 15% in the last 24 hours, outperforming the broader cryptocurrency market in the process.
Its rally comes after it rebounded from the weekly open around $0.1880 to hit the $0.2600 level earlier today.
However, it could face selling pressure in the near term as the 4-hour candle shows major rejection.
The derivative activity suggests investors remain cautious about the token’s longer-term recovery prospects.
According to CoinGlass data, perpetual futures Open Interest (OI) for dogwifhat averaged roughly $139 million on Wednesday, a sharp decline from the record $643 million reached in July.
The poor derivatives activity indicates that retail traders are still hesitant to aggressively re-enter the market despite the recent price rebound.
Weak participation could limit upside momentum in the short term unless confidence improves across the broader meme coin sector.
However, analysts consider a sustained increase in Open Interest as a potential sign of strengthening conviction among traders, which could support a more durable recovery and eventually fuel a broader bullish trend.
WIF faces major rejection at $0.2600
The WIF/USD 4-hour chart is bullish thanks to WIF’s rally over the past few days.
It temporarily tapped the $0.2600 resistance level but was immediately rejected, indicating that the buyers are not fully in control of the market.
However, WIF remains above the 50-day Exponential Moving Average (EMA) at $0.1930 and the Bollinger middle band near $0.1898.
The meme coin’s ability to hold above these levels suggests buyers are gradually regaining control following the recent correction phase.
Currently, the momentum indicators point to an overbought condition.
The Relative Strength Index (RSI) on the 4-hour chart at 76 shows that WIF is currently overbought and could face a correction.
Meanwhile, the Moving Average Convergence Divergence (MACD) histogram has turned green and continues to strengthen, reinforcing the case for further upside.
If the bullish trend persists, WIF could retest the $0.2600 resistance level in the near term.
This is possible if the bulls hold the support at the 100-day EMA near $0.2260.
A decisive daily close above this resistance level could pave the way for a broader bullish extension toward the 200-day EMA near $0.3452, which remains the key long-term upside target.
However, if the resistance level holds, WIF could encounter selling pressure in the near term.
If that happens, immediate support sits between $0.1930 and $0.1898, where the 50-day EMA and Bollinger middle band converge.
An extended selling pressure could see the $0.1666 support level come into play.
The post Why is Dogwifhat up 15% since Tuesday? Check forecast appeared first on Invezz