When it comes to understanding and investing in the stock market, it can be difficult to stay on top of all the current trends. However, knowing the basics and keeping track of key indicators will allow you to make informed decisions. One way to stay up to date is by using simple charts that quickly show how different markets are performing. This article will demonstrate three of the most important charts investors should know: market breadth, bond performance, and sentiment.
Market Breadth
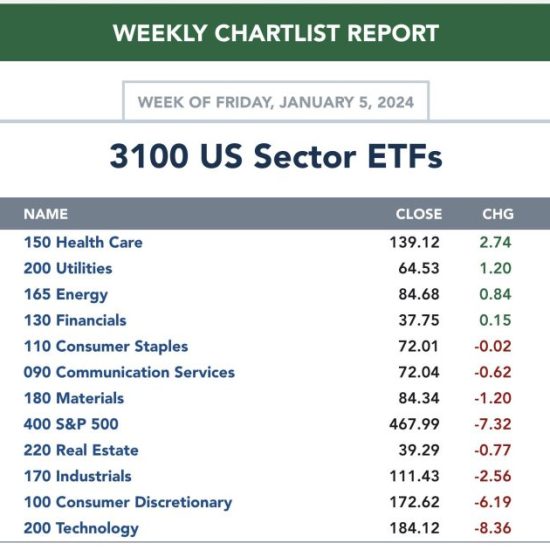
Market breadth is an indicator that tracks the number of stocks rising and falling in a given market. The chart shows the ratio of advancing stocks to declining stocks in the market, and it is a quick way to assess the degree of movement. When the ratio is high, it is a sign of a market rally, while a low ratio may indicate a selloff.
Bond Performance
Bonds can be a good way to diversify an investment portfolio and hedge against market volatility. Bonds move differently than stocks, which means they offer a different type of risk and return. A bond performance chart shows the performance of different types of bonds within a given portfolio. This can help investors determine how to allocate assets in an efficient way.
Sentiment
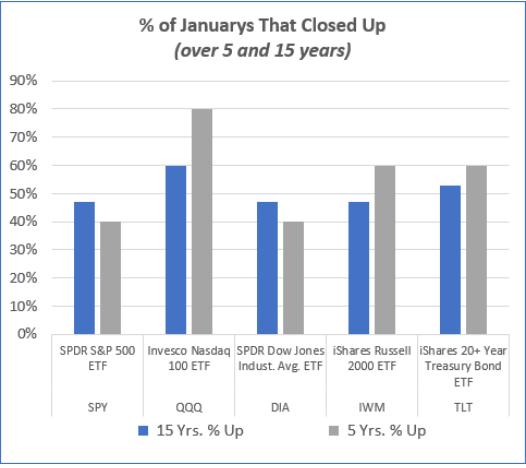
Sentiment in the stock market refers to investors’ outlook on the market in general, or their expectations of future stock performance. Sentiment is difficult to measure, but it can have a significant impact on stock prices. A sentiment chart can help investors identify whether the current market sentiment may be too optimistic or pessimistic. When sentiment is overly bullish, it may be an indication that a stock is overpriced and that a potential selloff may be near.
By understanding market breadth, bond performance, and sentiment, investors will be more informed and prepared for changing markets. With the right information, they can make informed decisions that move their investments in the direction they want. With the insights from these charts, investors can gain deeper knowledge of the stock market and make the best decisions for their portfolios.