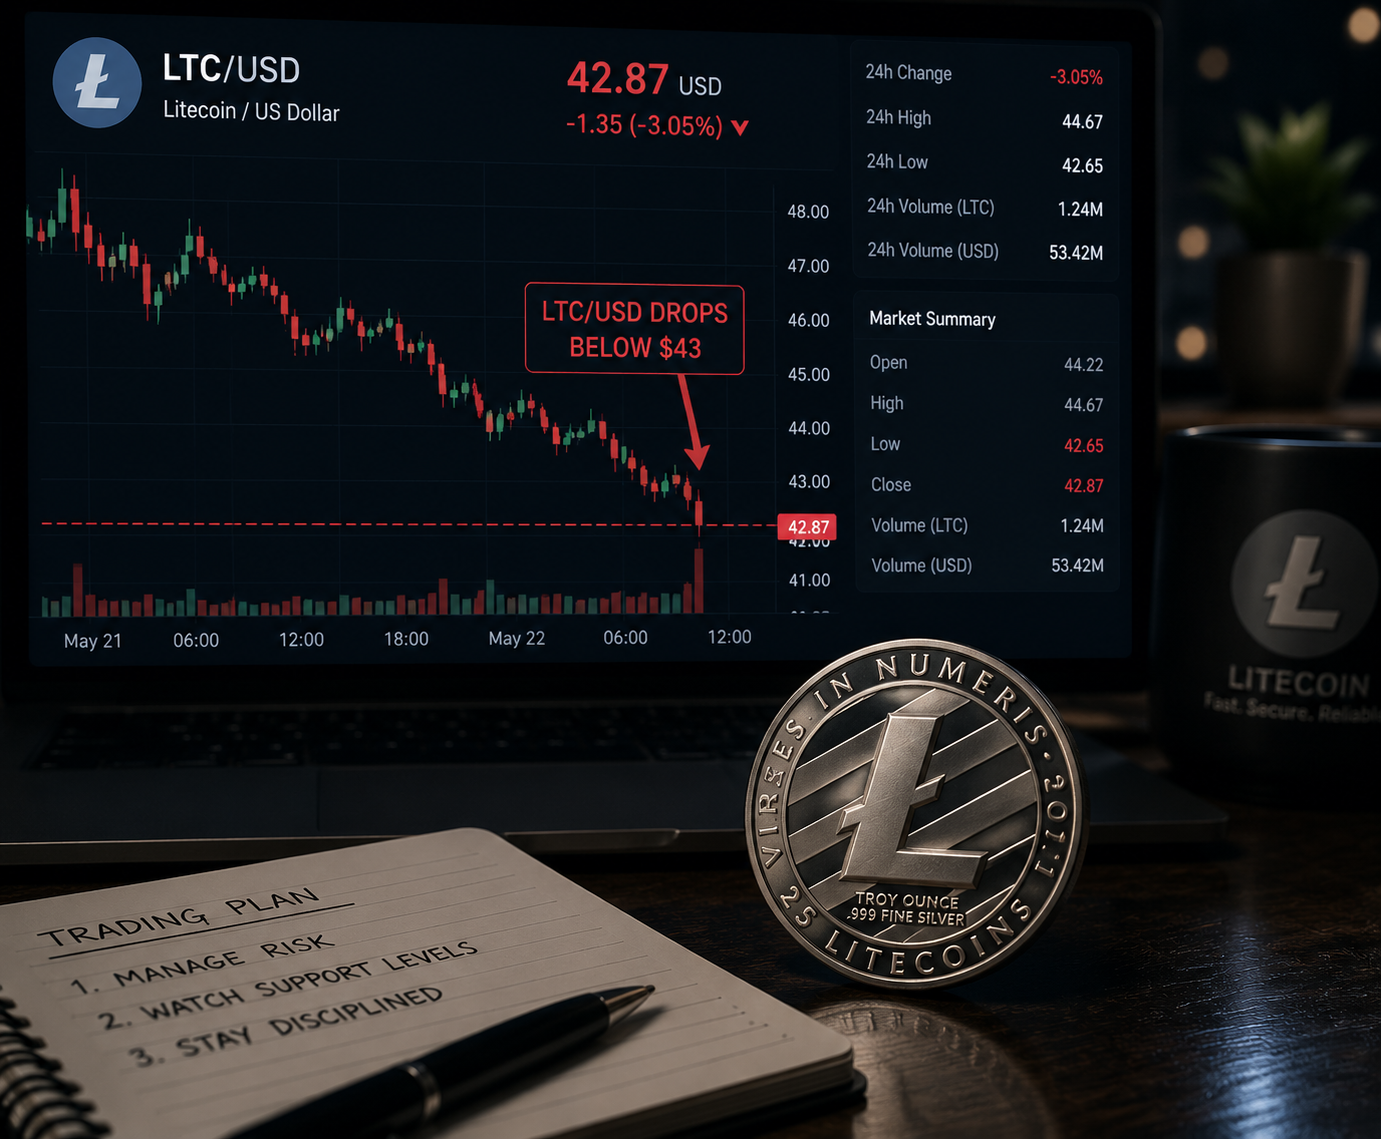
Litecoin (LTC) remains under heavy pressure, trading below $43 on Wednesday following a massive decline last week.
The broader trend across the market remains weak, and LTC continues to underperform as bearish sentiment builds in derivatives and spot markets.
Concerns are rising that LTC could soon test the $40 psychological level, with momentum still tilted to the downside.
Derivatives data signals weakening market participation
Litecoin is down by 1% in the last 24 hours and is now trading at $42 per coin.
Recent derivatives metrics point to fading investor interest and growing bearish bias.
Litecoin futures open interest (OI) has dropped sharply to $283 million, down from a May peak of $411 million, marking its lowest level since November 2024.
This sustained decline suggests reduced participation from leveraged traders and weakening speculative demand.
Sentiment in the derivatives market also reflects growing downside positioning.
Litecoin’s long-to-short ratio has fallen to 0.88, nearing its lowest level in over a month.
A ratio below 1 indicates that short positions are outweighing longs, signaling that traders are increasingly betting on further price declines.
With the derivative market still bearish, Litecoin could record further losses in the near term.
Litecoin price analysis: LTC price structure remains bearish
The LTC/USD 4-hour chart is bearish as Litecoin is currently trading at around $42.54, maintaining a clear bearish structure.
The coin is currently trading below the 50-day, 100-day, and 200-day EMAs, reinforcing the descending trendline that has kept the price bearish in recent months.
Similar to the derivatives, momentum indicators are also extremely weak at the moment.
The Relative Strength Index (RSI) of 32 on the daily chart means that Litecoin is oversold, suggesting stretched downside conditions.
The Moving Average Convergence Divergence (MACD) is still negative, confirming ongoing bearish momentum.
While oversold readings hint at potential short-term stabilization, there is no confirmed reversal signal yet.
If the market embarks on a rally, the buyers will face immediate resistance at the $50.18 level, just above the 4-hour Transactional Liquidity (TLQ) level at $47.
A daily candle close above this level could allow Litecoin to extend its rally toward the higher structure barrier around the $60.43 zone.
A recovery above $50 would be the first sign of stabilization, but reclaiming $55+ is needed to shift momentum.
On the flipside, if the bearish trend persists, immediate support lies at the $40 psychological level, with another major demand zone at $35.
A break below $40 could accelerate losses and expose LTC to a deeper corrective phase.
Litecoin remains firmly in a bearish phase, with declining open interest and negative positioning reinforcing weak market conviction.
While oversold conditions could trigger brief rebounds, the broader trend remains downward unless LTC can reclaim key resistance levels above $50–$55.
The broader cryptocurrency market continues to dictate Litecoin’s tone, and this could cap recovery efforts in the near term.
The post What next for Litecoin after dropping below $43? Check forecast appeared first on Invezz